Currently
If you’ve ever been frustrated with your seismic resolution and depth ties be sure to come to this month’s technical luncheon meeting November 17th. Morgan Brown’s talk, “Applications of Wave Imaging Technologies to Improve Onshore U.S. Prospecting” will offer insights on how to get more out of your data. And if that sparks your interest, you’ll be very interested to review Morgan’s slides reprinted in this issue. Also in this issue the “Life in the Patch” entry is an entertaining story with the curious title “The Land that Will Always Be Water” by Bernard Dietz. Finally, to local college students reading this – note the scholarship announcement posted in this issue. The application deadline has been extended to December 3, 2010, with awards presented at the December 15th luncheon meeting.
Recently
I just returned from the 60th annual GCAGS conference held in San Antonio. Not surprisingly, shale resource plays, highlighted by the Eagle Ford, was a dominant topic, but there was a good mix of sessions providing a variety of worthwhile topics. Attendance was strong with over 1100 registered. While attending the convention board of directors meeting, I was reminded that scholarship donations to affiliated societies (like us) are matched up to $10,000 by GCAGS. So, if you have procrastinated about making a contribution to the CCGS scholarship fund, let this be your incentive! And, finally, as if there was any question about the popularity of shale plays, the DUG (Developing Unconventional Gas) conference, underwritten by Hart Energy Publishers, was held in San Antonio a few days prior to GCAGS. Over 2000 attended – see Technical Editor Bob Critchlow’s notes on that event in this issue.
Commentary
Energy production and consumption in this country is an extremely complex mix of choices and subsequent consequences. And yet for all its intricacies, it is generally taken for granted, much like air or water. In an effort to put national energy use in perspective, and to provide our members with energy reality facts, I began reviewing energy production and consumption by source type. The numbers, as we all know, are huge (see below). We require a tremendous energy infrastructure to keep our modern lifestyle up and running. That got me wondering about the comparative basic energy content of our ‘primary’ energy sources without regard to market value (a primary energy source is one that provides direct power output like oil, gas, and coal, or solar photovoltaic and windgenerated electricity. On the other hand, electricity created from generators run by the combustion of fuel is an example of a secondary energy source). And that led me to try and relate the energy content of different primary sources using comparisons we can all get our arms around. For instance, how many “typical” oil or gas wells would we actually need to meet our entire national energy requirements? How many windmills equal the same energy output as an average local oil and gas well? How much coal must be produced to generate the same electrical output as a nuclear power plant? This letter, and those to follow, will attempt to answer those kinds of questions. To make the comparisons more meaningful, I have converted the energy from each source into barrels of oil equivalent (BOE), a unit familiar to those in and out of the energy business.
This month I present the big picture. Here’s the modern energy reality in America: each year the U.S. consumes the energy equivalent of 16.8 billion barrels of oil from all primary sources of energy 1(data as of 2000, latest year tabulated). No two ways about it, that’s a lot of stored energy being consumed. That works out to 59.25 BOE/person/year consumed in this country. What are the sources of all that energy? Well, according to the U.S. Energy Information Administration, domestically in 2000 we produced 2.1 billion barrels of oil2, leaving a 14.7 billion BOE energy hole to fill. Fortunately we have other plentiful primary energy sources in this country to help meet our needs. That same year we also produced and consumed 3.4 billion BOE of natural gas, 4.4 billion BOE of coal, 403 million BOE electricity from nuclear power plants, and 1 billion BOE from renewable energy sources3. That results in a total DOMESTIC primary energy supply of 11.3 billion BOE, which still left us with a 5.5 billion BOE shortfall. So, in 2000 we made up most of the difference by importing 4.2 billion barrels of oil and 680 million BOE of natural gas4.
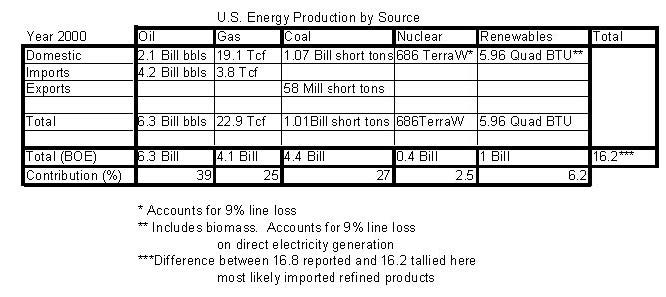
Energy consumption and imports ramped up a few percent during the decade that followed, but in the last couple of years have fallen nearly back to 2000 levels. In 2009, based on EIA data, energy contribution by source type, was: 38 % crude oil (1/3 domestic, 2/3 imported), 27% natural gas (5/6 domestic, 1/6 imported), 25% coal, 2.6% nuclear, and 8% renewables5. Note that compared to ten years ago, the percentage contribution is a little less for coal, and a little more for natural gas and renewables. Most of that increase in renewables is from wind power.
Corpus Christi resides in a county fortunate to fall within several prolific hydrocarbon bearing trends. I wondered how much the average Nueces county onshore oil and gas well contributes to meeting the country’s total energy needs According to IHS historical production data, 5125 completed wells in Nueces county have produced a total of 9.7 Tcf of gas, and 562 million barrels of oil6. That works out to an average recovery of 449 thousand BOE/well. From IHS I also determined the average lifespan of an average productive Nueces county well is 13 years. On an energy equivalence basis, it would therefore require 484,000 average Nueces county wells every 13 years to supply our nation’s needs at current consumption rates. Another way to look at it, the average Nueces county well could provide the total energy needs of 591 American citizens for 13 years. Now that’s a well I’d be proud to drill!
Next month: windmills and hydrothermal.
Rick Paige
CCGS President, 2010-11
——–
1 Salvador, Amos; Energy: A Historical Perspective and 21st Century Forecast, AAPG Studies in Geology #54, 2005. A must-have publication for anyone involved in the energy industry.
2 www.eia.gov
3 Ibid
4 Ibid
5 Ibid
6 IHS, Inc, Monthly Production Database, June, 2010
[Note: Energy conversion factors from The Geoscience Handbook, AGI Data Sheets, American Geological Institute, 4th ed, 2009, pgs. 249-251. For a spreadsheet of the data tabulations, please contact me.]