Currently
Shale resource plays continue to dominate our industry in cap ex, rig utilization, service company resources, and G&G. Regarding the latter, it behooves us all to learn as much as practical about how to high-grade these plays, and this month’s talk focuses on just that. David Paddock of Schlumberger will show us how to better utilize our seismic data to delineate shale sweet spots. Be sure to RSVP ahead of time to avoid paying the higher walk-up cost.
Continuing in the shale theme, Technical Editor Bob Critchlow has secured permission to publish a follow-up to last month’s talk on the discovery of Eagle Ford Hawkville Field by Gregg Robertson. “The Discovery, Reservoir Attributes, and Significance of the Hawkville Field and Eagle Ford Shale Trend, Texas”, by Charles Cusack, et al, created a huge buzz at the GCAGS convention last month when it was first presented, and we are pleased to be allowed to publish it here.
Recently
One of the two pilot schools in the “Boulders in Schools” project has been finished. The new Gloria Hicks Elementary School has three boulders on permanent display, with descriptive signage, located right beside the front entrance. Now an example of the three major rock types will be seen each and every day by all the students as they enter school. This is the kind of high visibility we strive for with all of our donated educational materials. It can’t help but spark curiosity and questions from the students. And to help the teachers feed that curiosity and answer those questions we plan to have a “Rock” curriculum written. Many thanks to all who helped get this test program underway, especially Dennis Moore who built and installed the signposts.
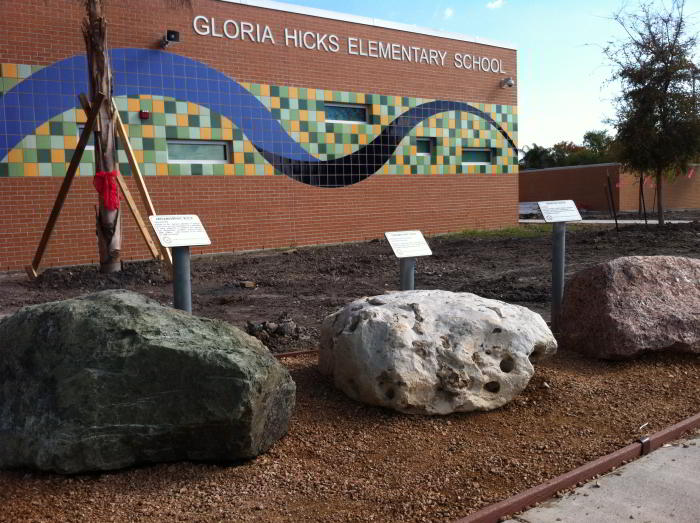
The Gloria Hicks Elementary School is now the very first to have all three of our educational initiatives (Maps, Bones, and Boulders) in place. The grand opening of the Gloria Hicks Elementary School is set for December 1st at 6:30 PM. I invite all interested members to attend and see for yourselves the large impact our educational initiatives are having in our local schools.
Commentary
Anyone living in the greater Corpus Christi area cannot help but notice the explosive growth of windmills across Nueces Bay, spreading over the open farm fields like gigantic cornrows. What you are witnessing is the development of the Papalote Creek wind farm, currently made up of about 230 wind turbines covering approximately 200 acres1. It’s a very interesting sight, made more so by the flatness of our area, and the rapidity of its growth. So, following up on last month’s ‘energy reality’ comparisons, I wanted to learn what impact this wind farm, and others like it, has on our national energy budget. To answer this I enlisted the help of Mannti Cummins, Wind Energy Director for American Shoreline, developers of the Penescal wind farm in Kenedy County.
The Papalote Creek wind turbines are rated at 2 megawatts, meaning they are capable of generating a maximum of 48 mW over a 24 hour period of continuously optimum conditions, which for this wind farm means a steady 25 mph, unidirectional wind. But since wind is never steady or unidirectional for that long, the expected electricity output of the San Patricio wind farm is reduced to 40%, called the “net capacity factor” (ncf). Wind variability is the single largest component in the ncf, but Mannti reports that it also takes into account air-flow wake effects between turbines, blade soiling, and line losses. He also reports that a 40% ncf represents a very good wind resource, so our coastal wind “fairway” is a premium location for wind power generation.
So, how does this equate with another energy source we are so blessed to have in abundance in our immediate area, namely oil and gas? Astute readers with good memories will recall that Tom Ewing recently published an interesting short piece in this publication attempting that very calculation2 He based his calculations on an average west Texas wind turbine rating of 1.5mW (36mW/day maximum). He determined that the power output of a single turbine is the equivalent of 21 barrels of oil equivalent (BOE) every day. He acknowledged, however, that his analysis was based on maximum potential windmill output and did not account for losses due to wind variations and other factors (i.e. ncf). To account for ncf, and to convert to a common energy unit, you will need to bear with me as I conduct some arithmetic conversions:
(48mW/day max) X (.4ncf) = 19mW/day
19mW/day represents an average of 792 kW per hour, or 792 kWh.
Converting to Barrels of Oil equivalent (BOE):
1kWh=3412 BTU
1Bbl Crude = 5.8 million BTU
So,
((792kWh) X (3412 BTU/kWh) X 24) = 65 million BTU/day
65 MM BTU/day
5.8 MM BTU/day = 11 BOE/day/wind turbine
This places the output of one windmill in the stripper range of oil equivalent production. That compares with 95 BOE/day average over a 13 year life for a typical Nueces County O&G well (see November 2010 President’s Letter)3. That means on any given day it requires 9 wind turbines to match the thermal energy contained in the hydrocarbon output of 1 typical Nueces County oil and gas well.
Mannti informs me that in a flat, open wind-fairway like we have, 50 acre minimum spacing between wind turbines is optimum. Supplying our entire national energy demand of 16.8 billion BOE (see November 2010 President’s Letter) would then require 4.2 million turbines occupying 209 million acres (ignoring for the moment the output would be entirely in the form of electricity).
That is clearly unachievable, but to be fair, no one is suggesting that wind power can, or even should, supply our entire national energy budget. And it’s worth noting that there are some features of wind-generated electricity that are superior to oil and gas wells. For one, there is virtually no discovery/completion risk. Further, the primary energy source (wind) never depletes. Also there is no water consumption (or production) during electricity generation, an increasingly important consideration as our south Texas population grows. And, by converting the raw energy directly to electricity, wind turbines don’t suffer the estimated 68% loss of thermal energy when converting fossil fuels (a primary energy source) to electricity (a secondary energy source)4.
Which leads to this question: how do wind turbines compare to oil and gas on an electrical energy (not thermal energy) basis? If 100% of the hydrocarbon energy from one average Nueces County well were dedicated to generate electricity, then it would take about 3 wind turbines to equal its output. To put that into real world terms I conducted an informal and completely unscientific survey of my colleagues and determined that a typical south Texas single-family home consumes, on average, 1300 kWh/month. This means each Papalote Creek wind turbine can supply enough electricity to power 438 homes on an average day. Not bad. The typical Nueces County oil and gas well has the potential to supply electrical power to 1192 homes each day. Pretty good. Further, hydrocarbon fuel’s greater versatility provides a very important component of our energy budget, and in the electricity arena, its ability to supply peak-load demand is critical.
In the right regions, wind-generated electricity can supplement our electrical needs, and therefore reduce the rate of growth of hydrocarbon consumption somewhat. But it just can’t replace oil and gas in volume or versatility.
Next month: hydrothermal and nuclear.
Rick Paige
CCGS President, 2010-11
P.S. My thanks to Mannti for all the supporting data referenced in this letter.
——–
1 Mannti Cummins; personal communication
2 Ewing, Thomas; “Windmills and Oil Wells – Some Energy Equivalencies”, CCGS Bulletin, Feb, 2009, pg. 41-42.
3 Paige, Rick; Presidents Letter, CCGS Bulletin, Nov, 2010, pg 7-9.
4 Edison Electric Institute, 1971; as reported in The Geoscience Handbook, AGI Data Sheets, American Geological Institute, 4th ed, 2009, pg250.